Indicator Diagrams, Power card, Draw card, Power calculation
INDICATOR DIAGRAMS
1) The propeller is fully immersed.
2) The ship is fully laden at an even keel.
3) The ship is running neither with nor against a head wind or heavy sea.
4) The hull is not fouled by an under growth.
If the ship is lightly laden with the propeller partly immersed or if the ship is running with a favour of wind or sea the engine does not develop its full power than normal at same speed. Ship may be under exploited or overloaded…all these condition the diagram will be deceiving.
ADDITIONAL INFORMATION TO BE COLLECTED FOR CLEAR JUDGEMENT
1) UNIT NO.
2) Spring rating.
3) Engine R.P.M.
4) fuel pump index and governor index.
5) Load index.
6) Exhaust temp and pressure.
7) JCW outlet temp, piston cooling oil, cooling water outlet temp.
8) Scavenge temp and pressure.
9) Turbocharger R.P.M / exhaust gas back pressure.
10) Differential pressure in air cooler.
11) Air filter temp of air before filter.
12) Fuel consumption (Flow meter reading before and after on a time bound), cylinder oil consumption.
13) Ship draught
Precaution to be taken-
1) To reduce effect of friction the indicator card piston is removed, the piston and the cylinder is cleaned and lubricated.
2) The tightness of the indicator piston in the cylinder is checked. This is done by dismantling the piston and allowing it to drop slowly through the cylinder by its own weight. The bottom of the cylinder is closed and the piston should be held in its position.
3) The drum should not hit the stop at end position. Play in the pencil mechanism will distort he diagram.
4) The cock should be free from accumulation of soot and oil.
5) The stylus should be adjusted to a light writing pressure.
6) The drum when actuated the motion of the power piston by a cam should be correctly position. It then represents the travel of the power piston. In that case the compression and expansion diagrams with the fuel cut off should coincide.
Types of Indicator cards
The taking of indicator cards, allows the engineer to receive more information about the combustion process (via the draw or out of phase card), measure the cylinder power output of the engine (via the power cards), and check the cleanliness of the scavenging process (via the light spring diagram).
There are five types of indicator cards, which can provide the following information:
Power or in-phase cards

- Cylinder power, calculated from the area within the P~V diagram
- Indicates after burning present when card shape enlarged during the expansion stroke
Draw or out-of-phase cards
- Measurement of the compression pressure
- Measurement of the point of fuel ignition
Light/weak spring card

- Fouling of exhaust or scavenge gas flows
Compression card

– Measurement of the compression pressure
– Timing check of the indicator cam
Pressure derivative

- Measurement of the point of fuel ignition
- Measurement of the maximum rate of pressure rise following initial combustion
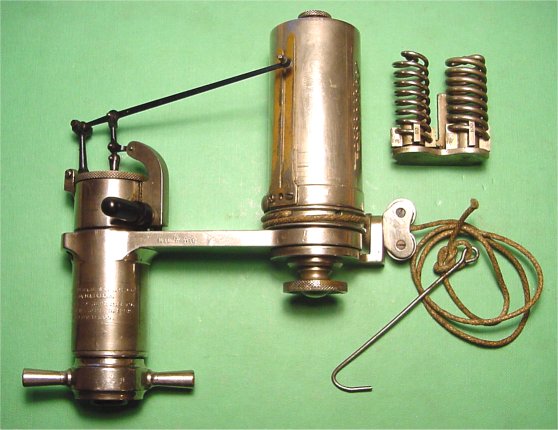
PROCEDURE TO OBTAIN INDICATOR CARD
- Take proper PPE protections like gloves, goggles, safety shoes and proper outfit.
- Use proper tools supplied with the instrument to open and close the cocks.
- Stretch diagram paper firmly over the drum.
- Before connecting the instrument to the Indicator cock, open indicator cock, allow two or three firing strokes, to blow out soot and combustion residues in the cock.
- fasten the instrument to the cock so that the cord is taut.
- Take the atmospheric line with the cock shut.
- Open the indicator cock and lightly press the stylus against the paper and make vertical lines as the piston moves up and down, when you are ready to pull the roller string, make sure it is in the bottom and pull the string till the cycle is described.
- Close the cock
- Disconnect the cord.
- make sure that the instrument is not exposed to high temperature for long time. This may affect its accuracy. Remove the hook, turn the drum by hand to a place clear form for the power diagram, take compression pressure line with the fuel cut off.
After taking indicator cards from all the cylinders, open the instrument and clean all the parts, and lubricate the same.
Analysis of the cards
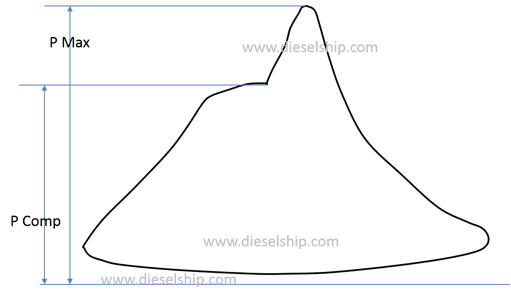
Normal Diagram

Maximum firing pressure is too high

– Compression pressure is very normal but the maximum firing pressure is too high compared to the normal diagram.
– The causes could be due to Early Injection; which is caused by
+ Incorrect fuel timing of the cams.
+ Incorrect VIT setting
+ Leaky fuel injector
Peak pressure is too low.

Below diagram shows; the compression is same but the peak pressure is too low.
This is due to late injection caused by the following factors:-
+Bad quality of fuel.
+Fuel injector nozzle blocked.
+Fuel pumps leaking.
+Low fuel pressure.
+Injector seized.
Compression pressure is low, and the peak pressure is also too low

Below deficiency diagram shows diagram shows that the compression pressure is low, and the peak pressure is also too low.
This can be due to the following reasons;
+ Leaking exhaust valve.
+ Leak through piston rings i.e broken or worn out piston rings.
+ High Liner wear.
+ Burnt piston crown.
+ Low scavenge pressure.
High compression pressure

Below diagram shows high compression pressure together with high peak pressure.
This can be as a result of the following:
+ Exhaust valve opening too late i.e incorrect exhaust valve timing.
+ Overload of the engine.
Power calculations:
Measuring indicated power of diesel engine
– The area can be measured by an instrument known as ‘Planimeter’ or by the use of the mid ordinates rule. [On modern engines this diagram can be continuously taken by employing two transducers, one pressure transducer in the combustion space and other transducer on the shaft. Through the computer we can thus get on line indicated diagram and power of all cylinders.]
– The area is then divided by the length of the diagram in order to obtain mean height. This mean height, when multiplied by the spring scale of the indicator mechanism, gives the indicated mean effective pressure for the cylinder. The mean effective or average pressure [Pm] can now be used to determine the work done in the cylinder.
Calculations

Area of the indicator diagram = a [mm2]
Length of the diagram = l mm
Average height of the diagram = a [mm2] / l [mm]
Average mean indicator pressure = a [mm2] / l [mm] X k [bar / mm]; Where k = spring scale in bar per mm
or
Pm = ( a / l) x k [bar]
Work done in one cycle = Mean Indicated Pressure x Area of the Piston x Length of stroke
= [Pm] x [a] x [l]
To obtain the power of this unit, it is necessary to determine the rate at which work is done.
Now, Indicated Power of Unit [ip] =Mean Indicated Pressure [Pm] x Area of Piston [A] x Length of Stroke [L] x Number of Power Strokes per Second [N]
Or
Indicated Power of Unit = Pm L A N
Unit of Final Result
Indicated Power = Pm L A N
= (A / L) X k [bar] x L [m] x A [m2] x N [1/s]
= [bar] x [m] x [m2] x [1/s]
= 105 N/m2 x m x m2 x 1/s
= 105 Nm/s
= 105 Joules/s
= 105 Watts
Hence, multiply the result obtained from calculating indicated power with 105 and the final unit will be in Watts.