Academics – Mathematics : 2011/MAR/05
Question
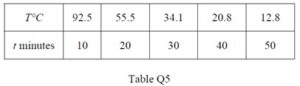
Q5. Table Q5 indicates the various temperatures T°C, of a cooling liquid after t minutes as recorded in an experiment.
The relationship between T and t is given by the formula:
T = T0 eat where a and T0 are constants.
(a) Draw a graph to verify this relationship. (8)
(b) Use the graph drawn in Q5(a) to determine EACH of the following:
(i) approximate values of a and T0; (4)
(ii) the temperature after 23 minutes; (2)
(iii) the time it takes for the temperature to fall to 25°C. (2)
Suggested scale: horizontal axis 2 cm = 5
vertical axis 2 cm = 0.2
Asked in Year/Month/Ques No.
Hello Guest User,
Answers are available via our app only.
Please buy a membership plan and login via our app to view answers.
Please buy a membership plan and login via our app to view answers.
Download our App